Global BI Implementation Benchmark Study 2025
Last updated: 03/02/2026 Executive Summary Despite annual spending exceeding $31.95 billion globally on business...

BI Project Cost Analysis: Budget vs Reality Study
Last updated: 03/02/2026 Executive Summary This research-backed analysis examines the gap between projected and actual...

Microsoft Power BI to Microsoft Fabric Migration Case Study
This case study serves to explore the intricacies of migrating a vanilla Power BI reporting solution to Microsoft Fabric. This case study describes the scope, structure and benefits of such a move as well as any difficulties encountered.

Replicating the Multi-level Order Report (MD4C) outside of SAP
During the build of this application, research provided insight into the frustrations that many BI developers are...

Improvement on the Decimal Shift & Decimal Shift Back in CURRENCY_CONVERSION article on the SAP Forum
We came across the post during one of our ETL projects. We are extracting data from SAP using Data360.Introduction We...

Empowering Businesses with Data Active Solutions
In an era where data reigns supreme, businesses are constantly seeking innovative solutions to harness the power of...

How to Apply and Maximise Data Analytics in Sector-Specific Scenarios
Business intelligence (BI) is defined as the collecting and organising of data, according to a pre-determined...

Implementing an Effective Business Intelligence Strategy
Gaining a competitive edge can mean the difference between a business simply surviving or thriving, between attracting...

Data Active – Creating a Robust Data Architecture
In today’s world of digital transformation and evolving business environments, where agility and real-time responses are critical in giving your company a competitive edge, you need a robust and scalable data architecture in place. It should be able to manage the collection, flow, storage and security of your gathered informatics, and successfully optimise your performance while still adhering to industry standards and best practices.
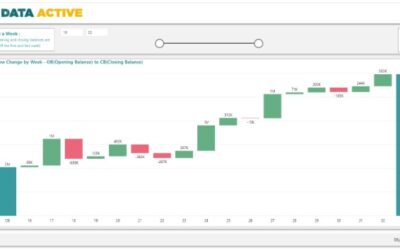
Creating a waterfall chart with dynamic opening and closing balances in Power BI
Power BI is a powerful data visualization tool, able to display vast amounts of data in easy-to-understand and...
Global BI Implementation Benchmark Study 2025
Last updated: 03/02/2026 Executive Summary Despite annual spending exceeding $31.95 billion globally on business...
BI Project Cost Analysis: Budget vs Reality Study
Last updated: 03/02/2026 Executive Summary This research-backed analysis examines the gap between projected and actual...
Microsoft Power BI to Microsoft Fabric Migration Case Study
This case study serves to explore the intricacies of migrating a vanilla Power BI reporting solution to Microsoft Fabric. This case study describes the scope, structure and benefits of such a move as well as any difficulties encountered.
Replicating the Multi-level Order Report (MD4C) outside of SAP
During the build of this application, research provided insight into the frustrations that many BI developers are...
Improvement on the Decimal Shift & Decimal Shift Back in CURRENCY_CONVERSION article on the SAP Forum
We came across the post during one of our ETL projects. We are extracting data from SAP using Data360.Introduction We...
Empowering Businesses with Data Active Solutions
In an era where data reigns supreme, businesses are constantly seeking innovative solutions to harness the power of...
How to Apply and Maximise Data Analytics in Sector-Specific Scenarios
Business intelligence (BI) is defined as the collecting and organising of data, according to a pre-determined...
Implementing an Effective Business Intelligence Strategy
Gaining a competitive edge can mean the difference between a business simply surviving or thriving, between attracting...
Data Active – Creating a Robust Data Architecture
In today’s world of digital transformation and evolving business environments, where agility and real-time responses are critical in giving your company a competitive edge, you need a robust and scalable data architecture in place. It should be able to manage the collection, flow, storage and security of your gathered informatics, and successfully optimise your performance while still adhering to industry standards and best practices.
Creating a waterfall chart with dynamic opening and closing balances in Power BI
Power BI is a powerful data visualization tool, able to display vast amounts of data in easy-to-understand and...