In today’s world of digital transformation and evolving business environments, where agility and real-time responses are critical in giving your company a competitive edge, you need a robust and scalable data architecture in place. It should be able to manage the collection, flow, storage and security of your gathered informatics, and successfully optimise your performance while still adhering to industry standards and best practices.
Advice
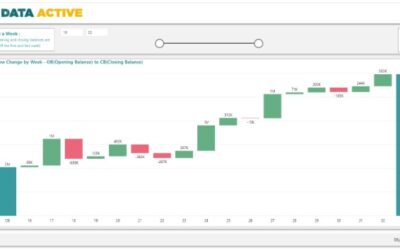
Creating a waterfall chart with dynamic opening and closing balances in Power BI
Power BI is a powerful data visualization tool, able to display vast amounts of data in easy-to-understand and attractive...
We used Power BI Report Builder to build a Multiple Page Report. Bonus: Waterfall Chart Tutorial
Intro to Paginated Reports. Power BI is a fantastic data visualisation tool. Providing many colourful and visually appealing...
Visualize SAP Data using Microsoft Power BI
Microsoft Power BI is a market leader in analytics, with strong interconnectivity. With this in mind, let’s see what makes it...


