
by dataactive_admin | Oct 13, 2023 | Advice, Case Studies
Power BI is a powerful data visualization tool, able to display vast amounts of data in easy-to-understand and attractive visuals. There are plenty of options to customise these visuals from colour, size, font types, line thickness, curve, and many more. Despite this...

by dataactive_admin | Mar 4, 2022 | Case Studies
Original Article on LinkedIn As I have recently left a consultancy (which started more than 8 years ago), I now have time to look back and reflect on both my career to date and the broader BI Industry. And by the way, the career is just getting started! Perhaps the...
by dataactive_admin | Mar 1, 2022 | Case Studies
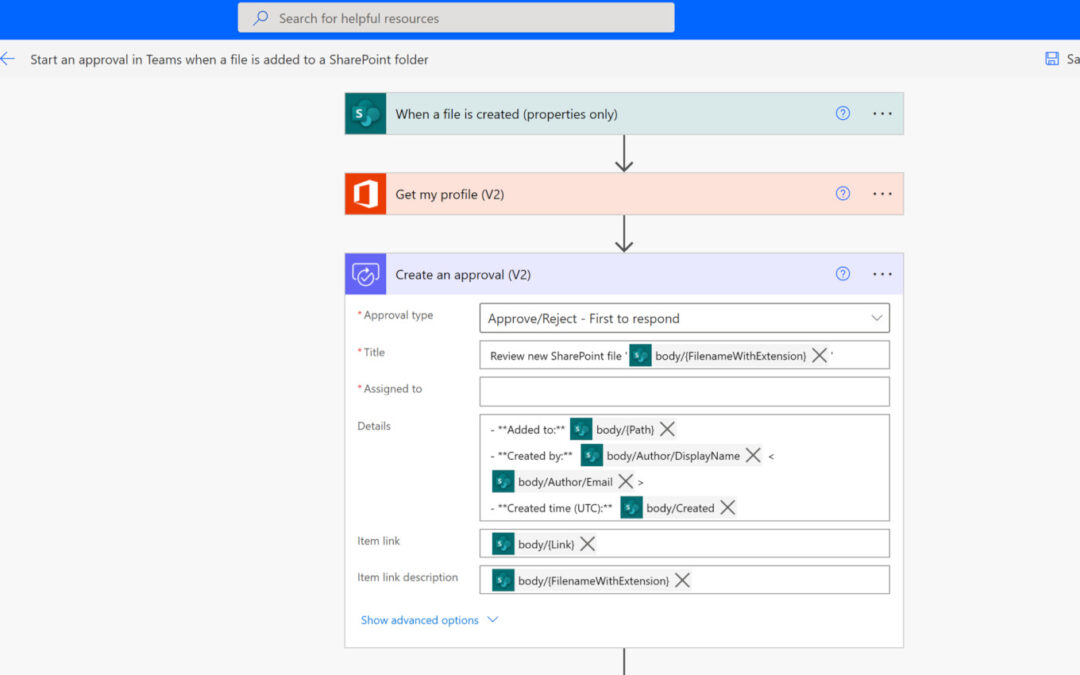
We would like to discuss how to use Power Automate to monitor your Qlik Sense Proxy Service (QPS), determine its availability, and send notifications to the appropriate technicians when it’s not accessible. What is Qlik Sense Proxy Service? The Qlik Sense Proxy...

by dataactive_admin | Feb 10, 2022 | Advice, Latest Projects
Intro to Paginated Reports. Power BI is a fantastic data visualisation tool. Providing many colourful and visually appealing graphs, charts, and tables aimed at helping you tell the story of your data. Power BI is perfect for interactive reports. Not so much for...

by dataactive_admin | Jan 24, 2022 | Case Studies
Companies that run SAP have a wealth of data at their disposal. This data can be harnessed tomake more informed business decisions that can significantly impact the bottom line. However, this is a challenge for many SAP companies Creating the necessary reports and...